Dashboards
Data Visualisation
The designs below show some of the report dashboards I have created with the aid of Power BI and Tableau
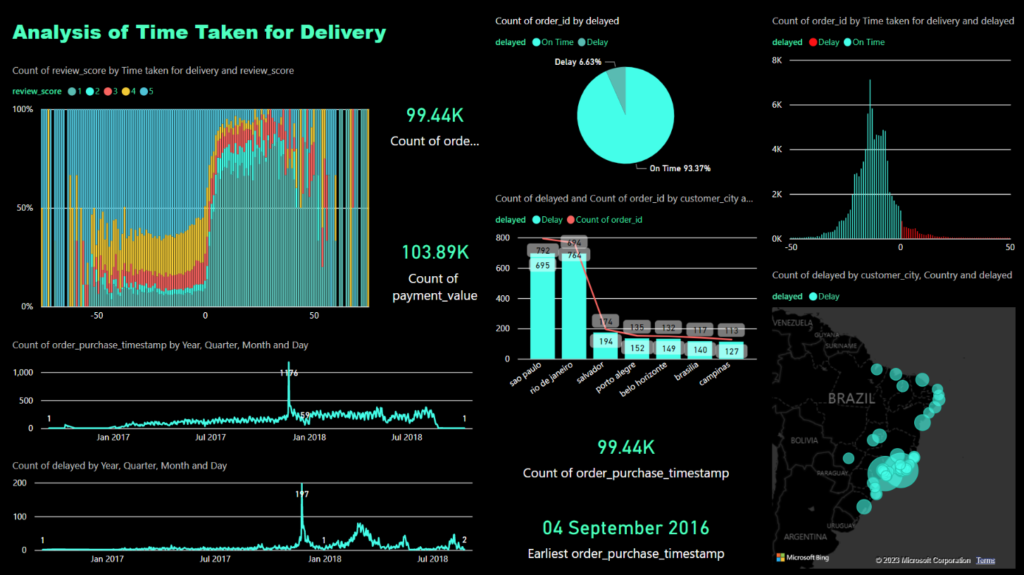
Analysis of Time Taken for Delivery using Power BI.
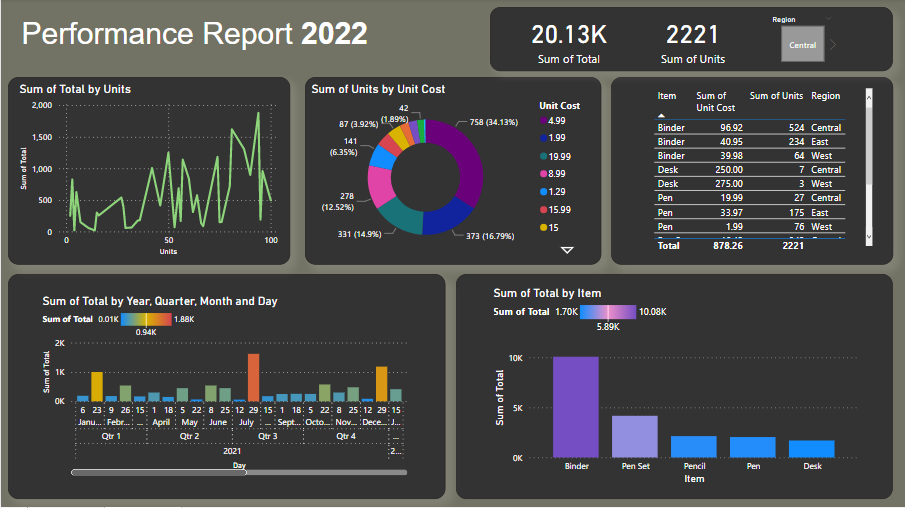
Performance Report created using Power BI.
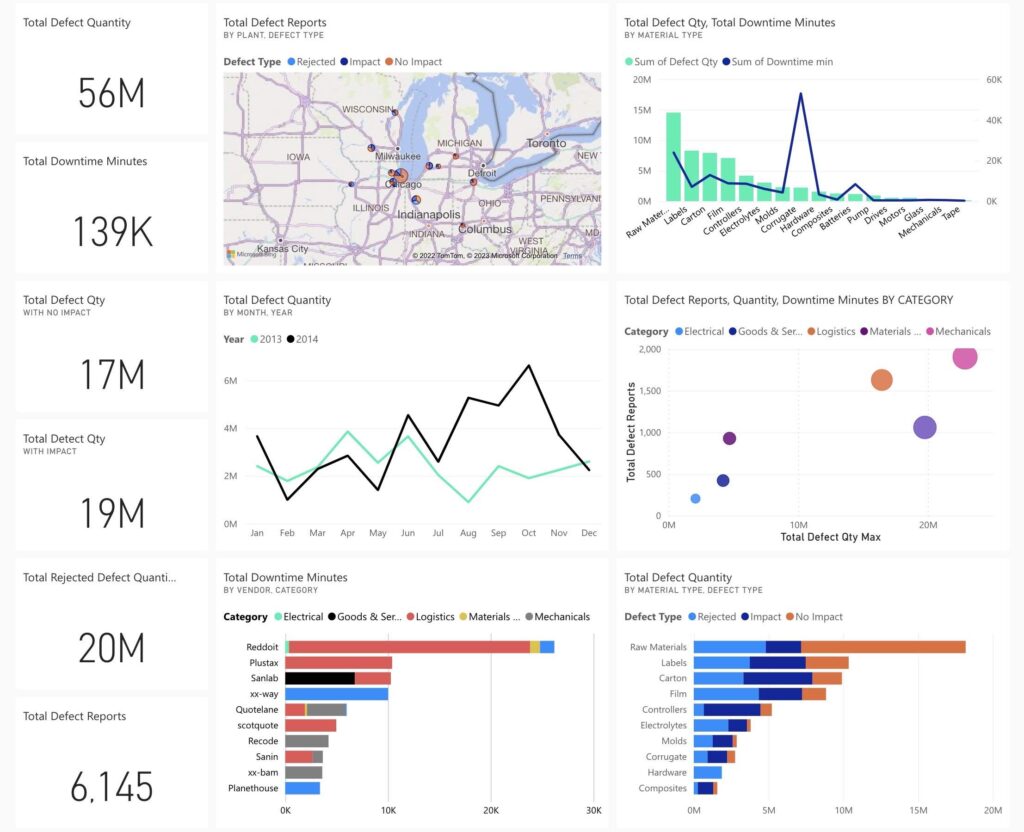
Performance Report for Supplier quality analysis investigating best and worst suppliers.
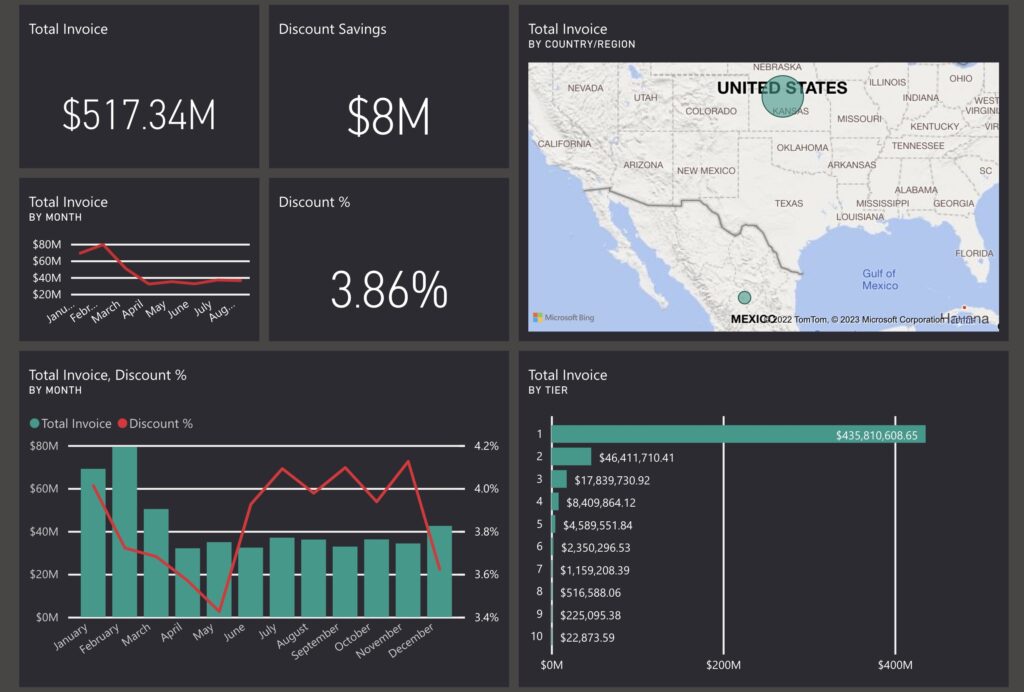
Performance Report for Procurement analysis investigating invoice discounts by month.
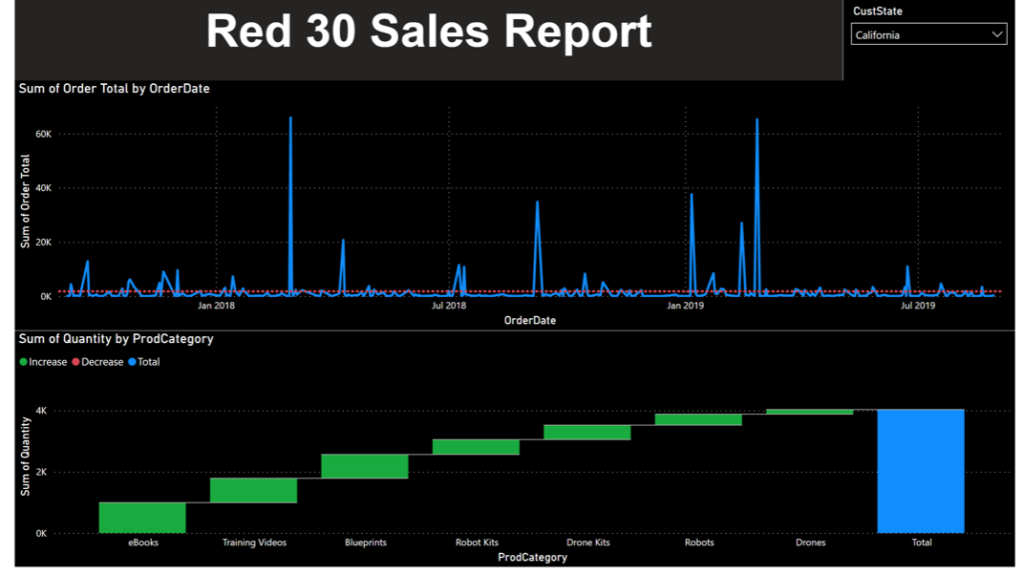
Analysing Total Products and Total orders by Products per states using Power BI.
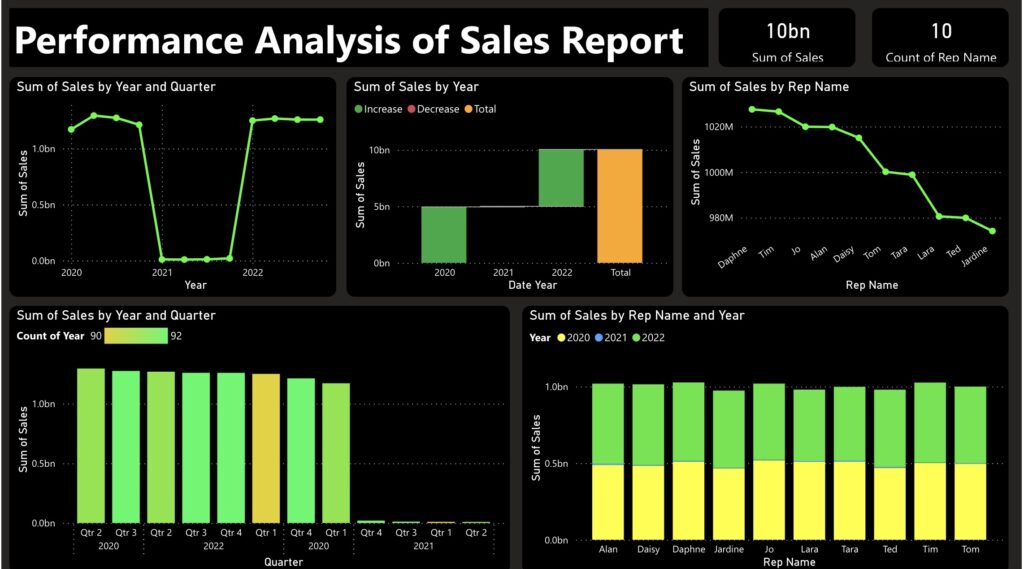
Performance Analysis Comparing sales and Representative created using Power BI.
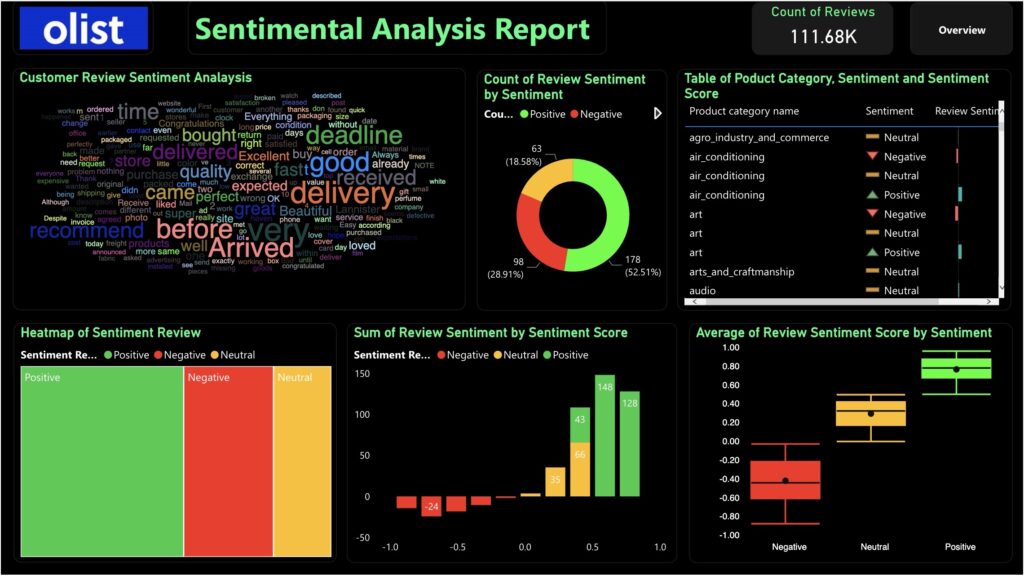
Sentimental Analysis Report comparing review sentiments and sentiment score created using Power BI.
Data Preparation and Cleaning
Python project
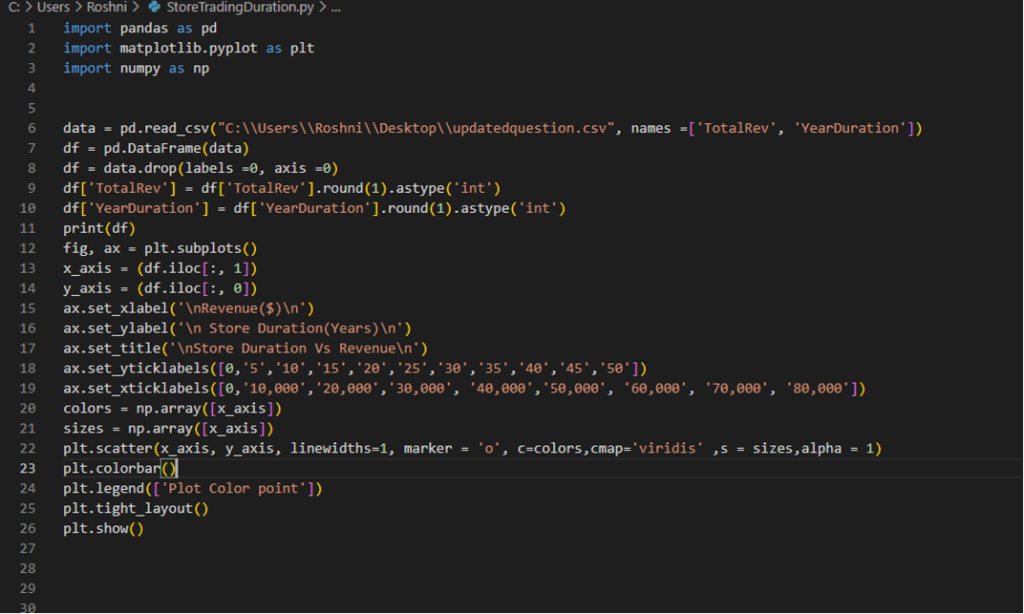
Python Code for Cleaning and Generating Scatter Plot for Revenue.
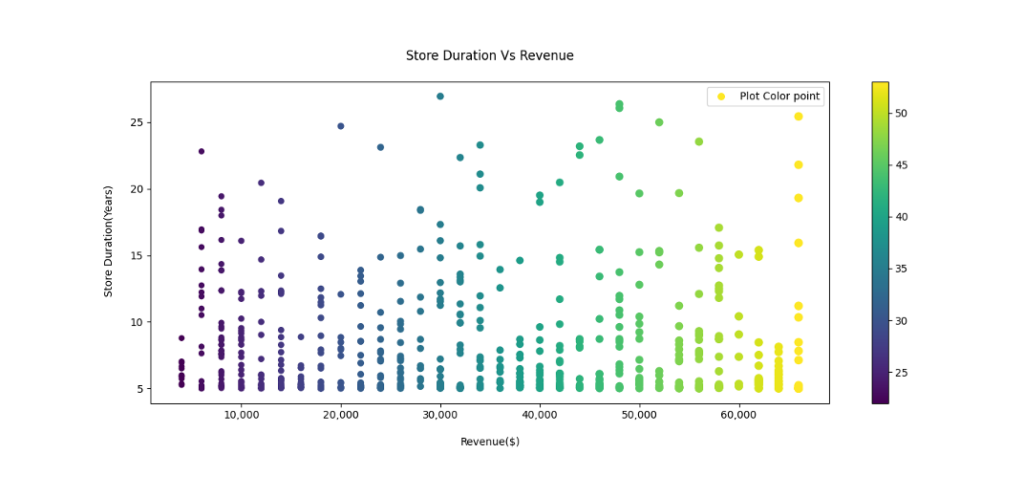
Scatter Plot generated from Python Code for Store duration and Revenue.
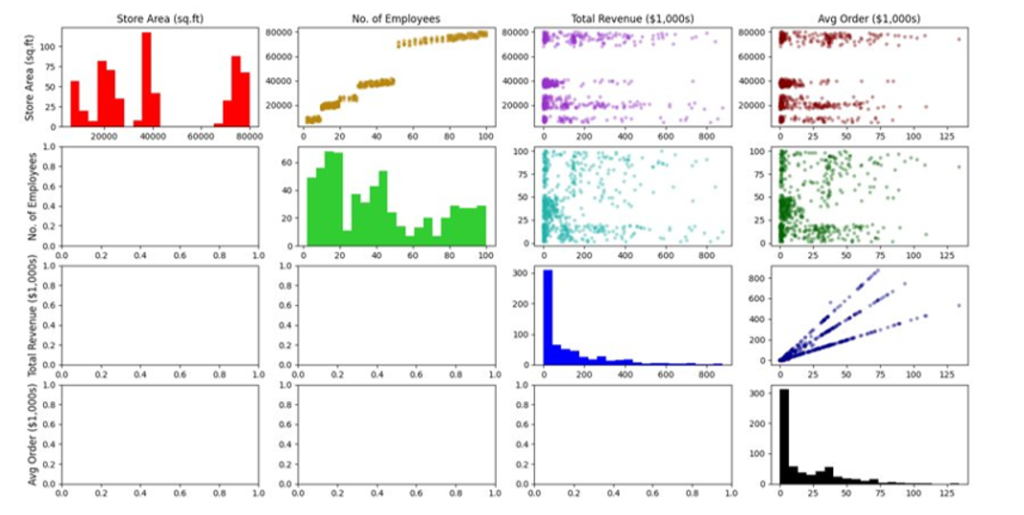
Plots generated from Python Code investigating Store Area, Revenue, Number of Employees and Average Customer Order.
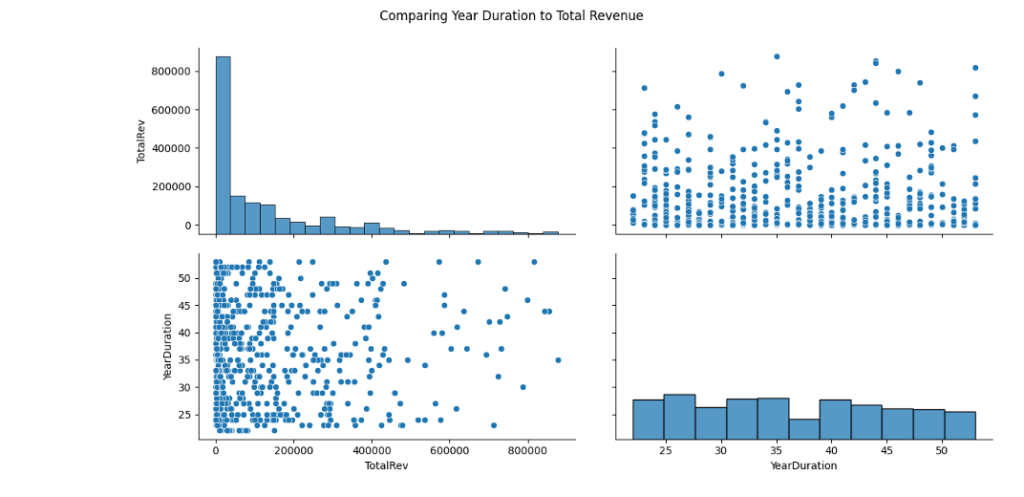
More Plots generated using Python Code for visualizing Revenue.
Microsoft Excel and Power Query
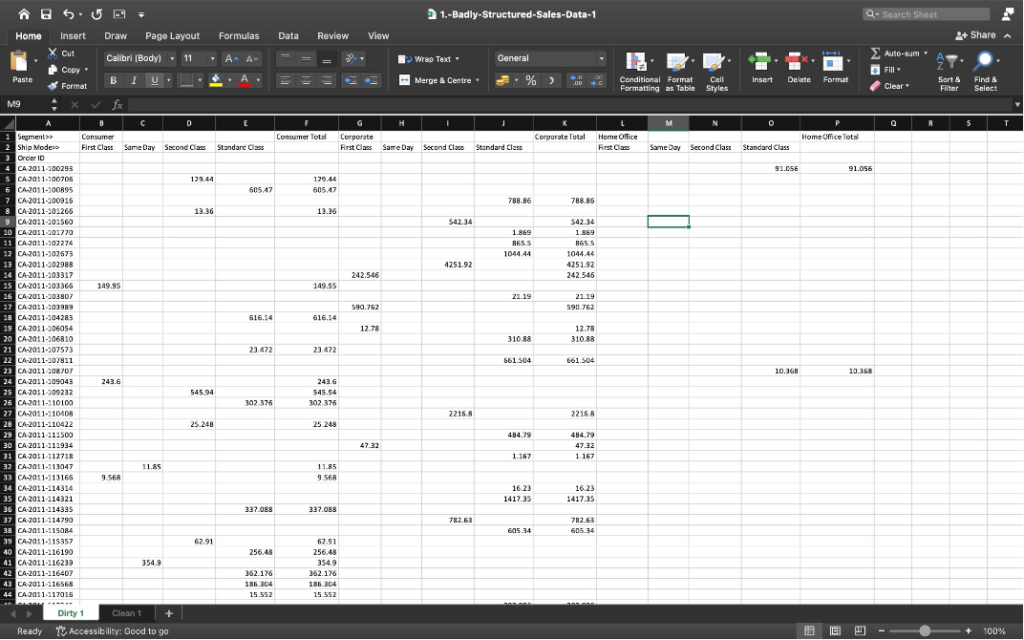
Data cleaning using Power query for Sales Data.
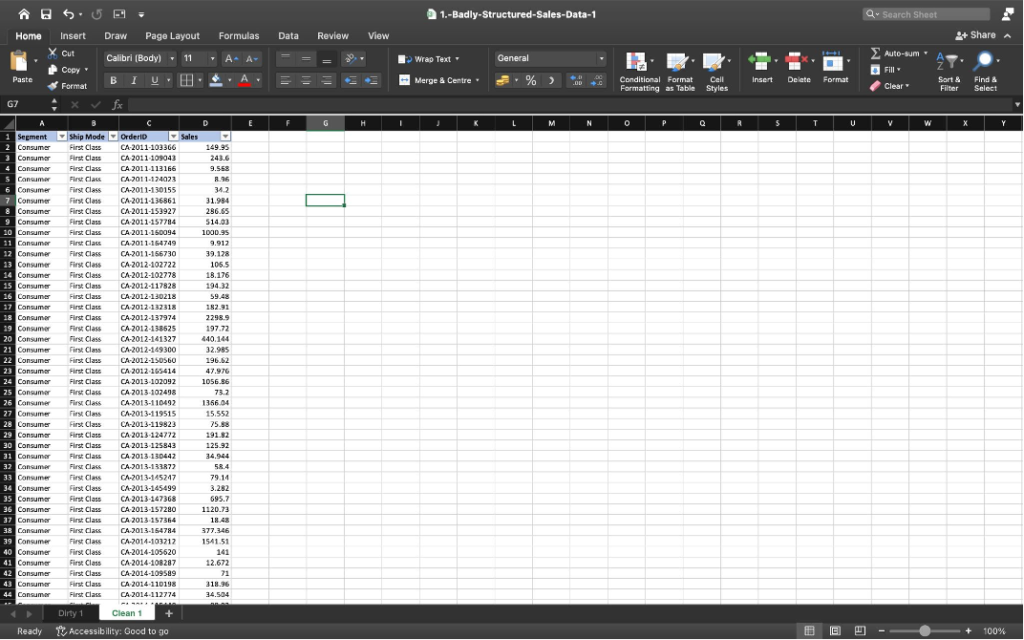
Result of Data Cleaning of Sales Data.
SQL Project
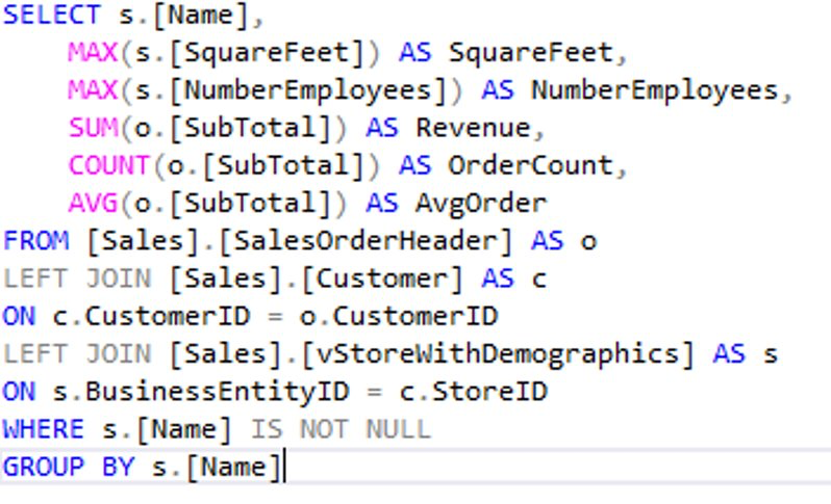
SQL Query using Left Joins to query Customer Sales Order.
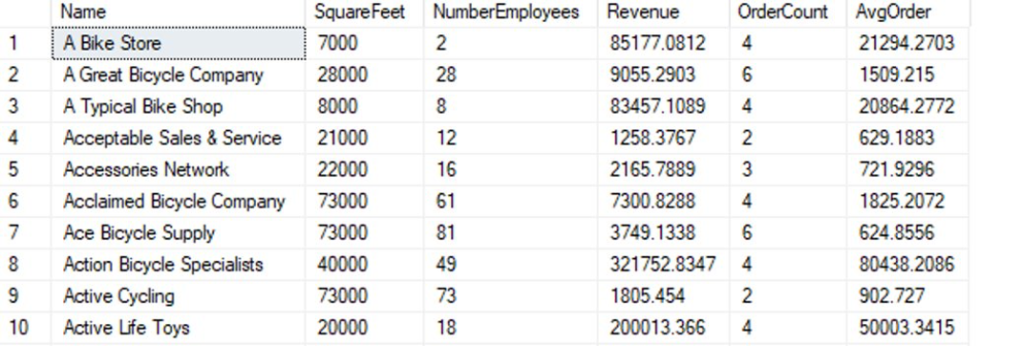
Table generated from the query of Customer Order.
