Hello, my name is
Mololuwa Moses
Data Insight Analyst at Financial Times
- mosesmolo@yahoo.com
- +44-731-293-7900

About me
I am an expert insight analyst with experience in uncovering insight and valuable information to inform strategic decisions. I am a critical thinker, team player, and excellent communicator with a passion for telling stories with data. I am skilled in communicating quantitative results to a broad audience through writing and compelling data visualization. I also have strong statistical and analytical skills and I am proficient in using various software tools, including Python, SQL, Tableau and Power BI. I have a proven ability to multitask and prioritize effectively in fast-paced environments. My key achievements include collaborating with a cross-functional team to pioneer and spearhead the Financial Times adoption of a Health Score Metric for B2B Accounts, resulting in an 100% improvement in identifying account risk and opportunities and an 75% increase in customer retention rate.
I analyse data to uncover insights and trends to aid business decision making processes.
With several years of experience as a data analyst I understand the need of an organisation to immediately identify trends, patterns and relationships and develop effective strategies to drive business growth and performance.
I’ve spent most of these years working across different branches of data analysis including but not limited to predictive analysis, exploratory analysis, and descriptive analysis. Having worked on various projects, I am keen on uncovering insights and trends to discover and understand patterns, relationships, and underlying factors within data that are not immediately obvious.
What I do
From understanding company’s data requirements to designing a blueprint and creating visualisations for data, I do everything that falls in between these lines.
DATA Discovery & preparation
An effective data analyst understands the importance of formulating hypothesis for resolving business challenges . I make sure to examine business trends and make case studies of similar data analytics and Study the domain of business industry.
model planning & model building
I make proper planning of the methods to be used for building data models and developing training and testing models. I make use of data analytics tools like Python and SQL in this phase.
Visualisation & operationalization
I create visualisations to communicate my findings to my team and other stakeholders. I make sure complex data are simplified and visualized in an easy to understand format. This
helps in making business descision making easier.
Skills
My Experience
DATA INSIGHT ANALYST
FINANCIAL TIMES July 2023 – PRESENT
- Analyzed the B2B customer journey to gain insights into growth drivers, potential bottlenecks, and areas for improvement while visualizing result on Looker
- Developed an Account Health Score metric using various statistical techniques to identify risk and opportunities within an account using Python and integrating the score into Sales Force for the Sales team and CRM team leading to 75% improvement in account management effectiveness
- Identified growth opportunities within B2B accounts by conducting segmentation analysis on lead source based on territory, industry, customer behavior, and other relevant factors thereby improving 65% targeted marketing ROI
- Utilized predictive modeling techniques to forecast future customer behavior and uncover opportunities for upselling or cross-selling contributing to a 5% increase in revenue.
- Established performance indicators aligned with different stages of the customer journey to give a better insight into customer behavior
management information system ANALYST
Sir George Monoux College March 2023 – June 2023
- Developed, maintained, and supported a large suite of reports using MS-SQL, Reporting Services like SSRS, Excel, and ProSolution, resulting in a 30% increase in the accuracy and timeliness of data reports.
- Spearheaded the college’s adoption of Power BI dashboards, resulting in a 25% reduction in report development time and a 50% increase in data accessibility for stakeholders.
- Collaborated with Senior Leaders and Middle Managers to analyze data, identify trends, monitor achievement against various targets, and report significant variances, resulting in more informed strategic and operational decisions.
- Produced ad-hoc and complex data reports as needed, supporting college staff in their performance management, resulting in a 20% increase in the use of data to inform decision-making
- Ensured robust testing is carried out prior to introducing new or changed reports, resulting in a 5% reduction in report errors
- Developed links between College information systems to improve the integration and effective use of data across the College, resulting in an 8% increase in data accessibility and usage
- Led and participated in projects, working with MIS & Exams staff, Curriculum teams, and student experience teams, improving the effectiveness and efficiency of college operations.
DATA ANALYST
Generation UK & Ireland Nov 2022 – Feb 2022
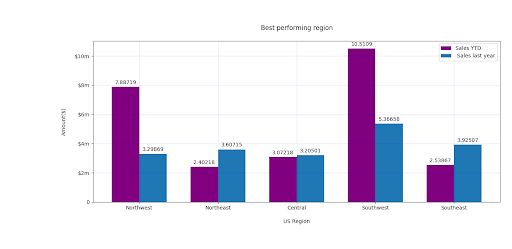
- Extracted, transformed and loaded (ETL) multiple Financial data using Microsoft Excel and Power Query, and generated insights using Power BI to determine best product category and sales order insights for clients.
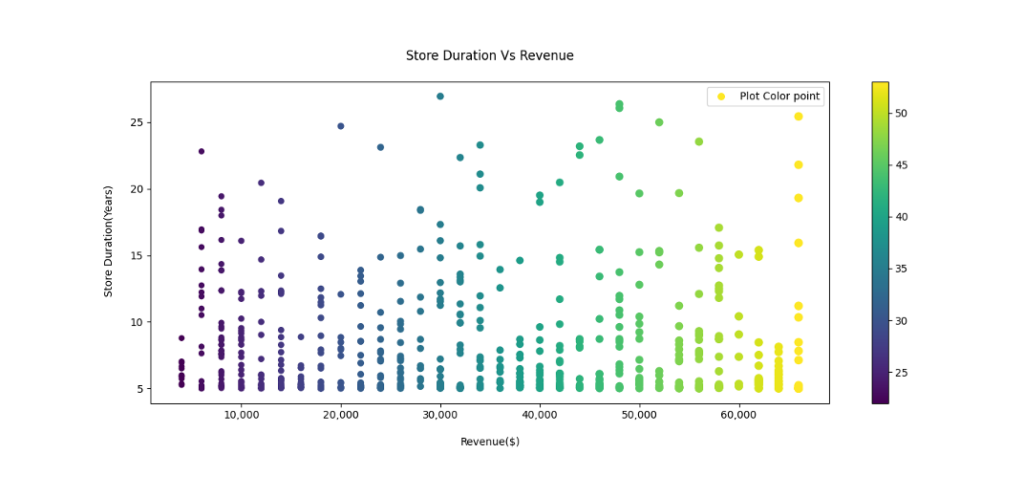
- Cleaned and Prepared Sales data using Python to determine correlations between Store locations and Revenue and presented a report using Microsoft Power Point
- Developed a statistical analysis and machine learning model on Python to Predict Market Price Movement using Logistic Regression on market Historical Data. While also computing the probability of a positive or negative return every 5 minutes based on the historical data
- Analyzed and visualized Customer data from a large survey on consumer behavior, including data cleaning and preprocessing on Microsoft SQL Server using T-SQL, and created visualizations to illustrate key trends and patterns
- Extracted unstructured streaming data from Azure Blob Storage for big data analytics.
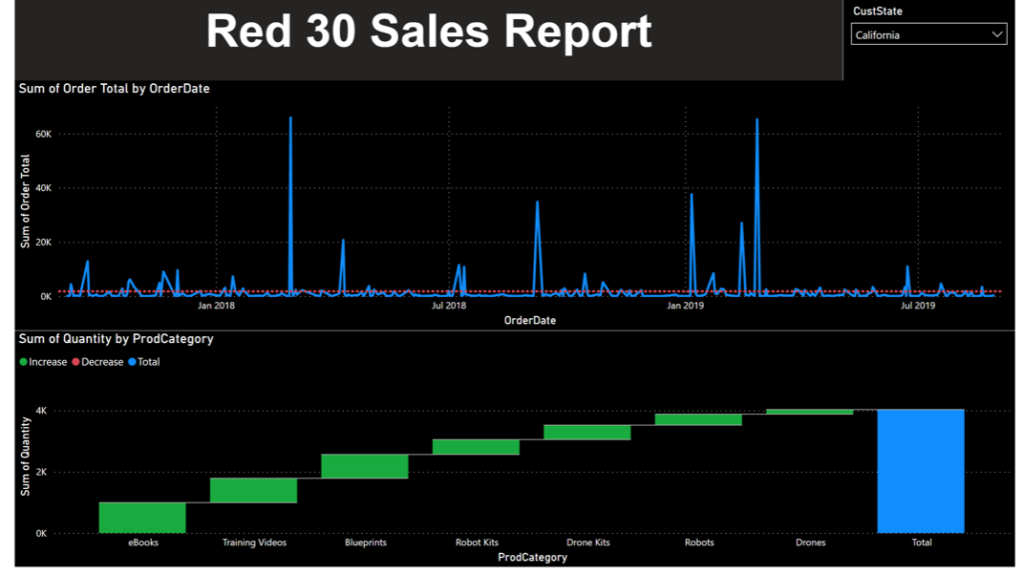
- Designed a dashboard using Power BI to track key performance indicators (KPIs) for a marketing campaign, including impressions, clicks, and conversions. Presented the dashboard to senior management during weekly team meetings
DATA ANALYST
Prec Pearl Limited OCT 2018- JAN 2021
- Created a series of dashboards using Power BI to visualize data from a customer survey and identified key trends and insights. Presented the dashboards to the client during a meeting to discuss the findings and next steps
- Implemented the use of MySQL Workbench to create relational database for the improved data accessibility within the organization
- Built a Report Dashboard using Power BI for supplier quality analysis investigating the best and worst suppliers with respect to quality and identifying the best industrial plants for minimizing downtime
- Applied statistical techniques such as SVM classification model to customer outage data to improve business decision-making
- Designed solutions for customer management using Microsoft Excel and predictive modelling on Python


